Redstone delivers institutional grade portfolio analytics, scoring 3,400+ stocks and ETFs with Sharpe, Sortino and 20+ risk metrics.
What is Redstone?
Redstone is a portfolio optimization and risk analytics platform that converts raw market data into statistical measures individual investors can act on. The problem it addresses is an asymmetry of information: retail investors can easily check how much a holding returned, but rarely know how much risk produced that return. Redstone computes more than 20 institutional metrics, scores every ticker out of 100 against its peers, and presents the results in a browser based dashboard rather than a spreadsheet. It is aimed at self directed investors, quantitative analysts, finance students and anyone assembling model portfolios who wants the language of a hedge fund desk without an enterprise terminal subscription.
Key Features
- Stock and ETF screeners filter a universe of more than 3,400 securities by return, volatility, drawdown and dividend yield, letting investors build a shortlist in minutes instead of hours.
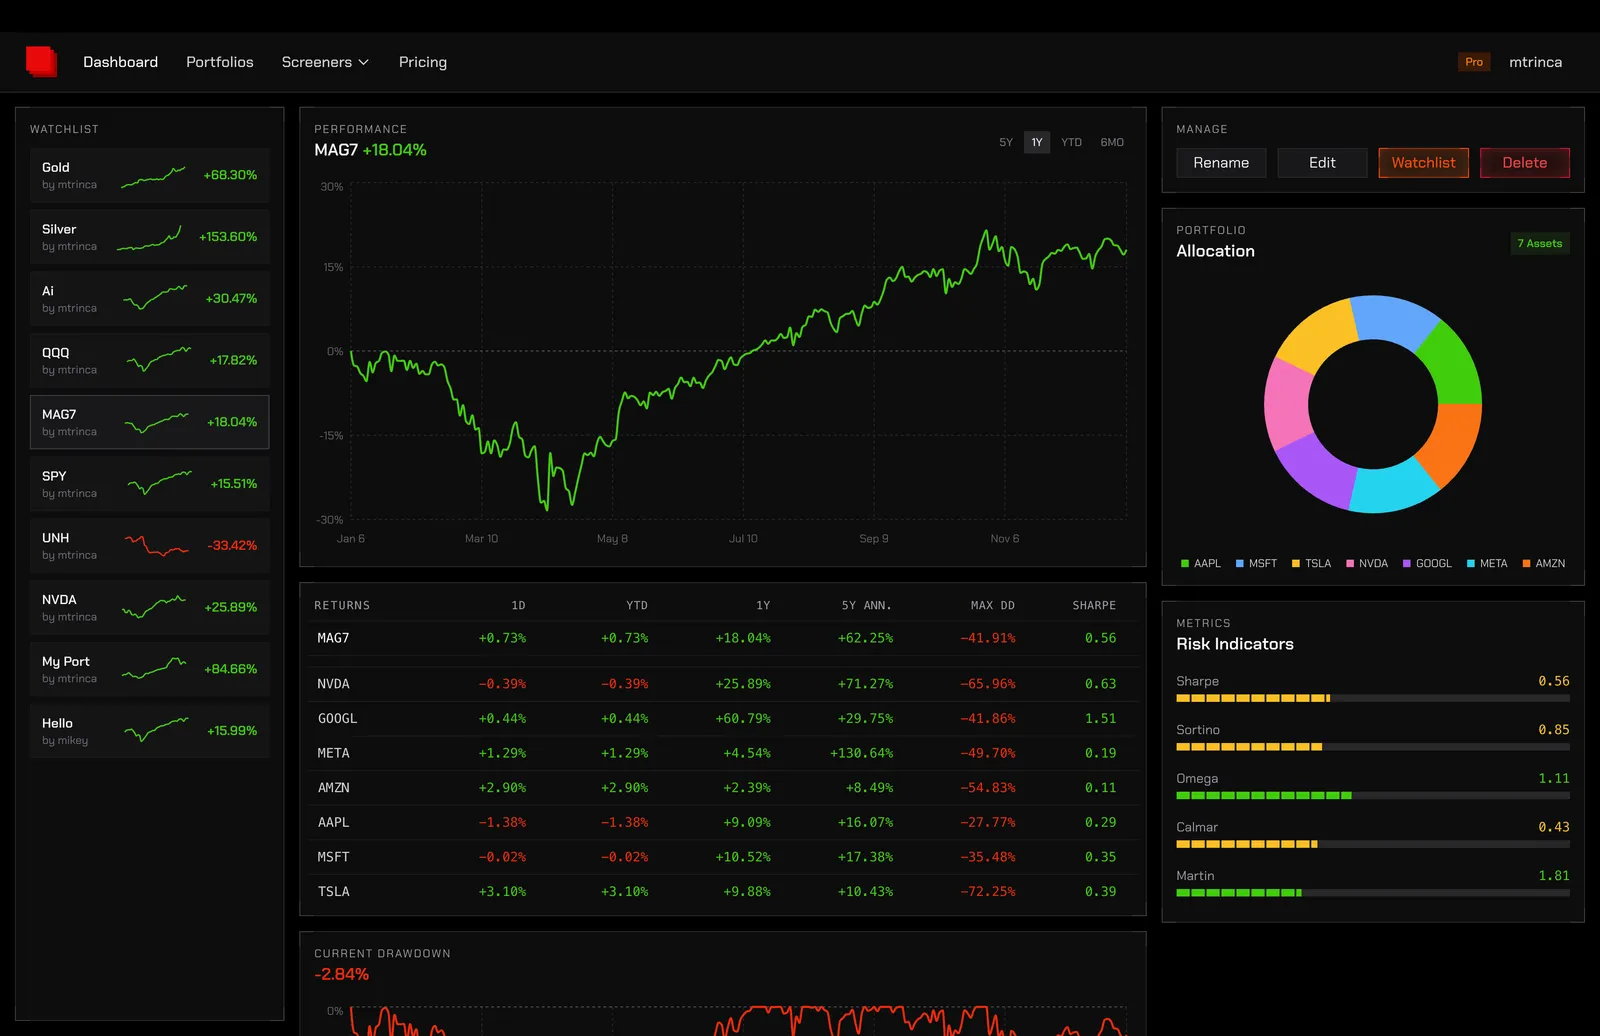
- A deep risk metrics library goes well beyond the usual volatility figure, surfacing Sharpe, Sortino, Omega, Calmar and Martin ratios alongside alpha, beta and maximum drawdown, with colour coding applied to each value.
- Peer ranking out of 100 places any ticker or portfolio on a percentile scale for one year return, five year return, Sharpe ratio, drawdown, volatility and dividend yield, which makes relative performance legible at a glance.
- Head to head comparison sets any two tickers or portfolios side by side, and the site pre-builds popular matchups such as VTI versus VOO, QQQ versus VOO, JEPI versus JEPQ and SMH versus SOXX.
- Community portfolios can be browsed, cloned and shared, with ready made examples such as MAG7, a Berkshire Hathaway top ten replication and a Dalio style All Weather allocation available on the landing page.
- Allocation and drawdown visuals pair a holding breakdown chart with a current drawdown curve, so concentration risk and recent pain are visible without manual calculation.
Use Cases
A retail investor holding a concentrated basket of mega cap technology names can run that basket through Redstone to discover its Sharpe ratio of roughly 0.29 trails most alternatives on the platform, then test a reallocation before committing capital.
A finance student comparing index funds for a coursework project can open the VTI versus VOO comparison page, read returns, drawdowns and risk metrics side by side, and cite the output without building a model in Excel.
An independent analyst publishing research can construct a portfolio, keep it private on the Plus plan, and later make it public so readers can clone the allocation and follow its live statistics.
How Redstone Handles Pricing
Redstone uses a three tier subscription structure. The Starter plan is free and includes five portfolios, ten assets per portfolio, three optimizations per day, twenty five watchlist items, every chart and risk metric, plus access to the stock, ETF and portfolio screeners. The Plus plan at $15 per month raises those ceilings to twenty five portfolios, twenty five assets each, fifty optimizations per day and fifty watchlist entries, and adds private portfolios. The Pro plan at $50 per month removes the limits entirely, lifts the watchlist to seventy five items and adds priority support with early access to new features. Notably, no analytical metric is gated behind payment, which is uncommon among retail finance tools.
Frequently Asked Questions
Is Redstone free to use? The Starter tier costs nothing and unlocks every chart and risk metric, five portfolios and three daily optimizations, while heavier usage requires the $15 Plus or $50 Pro plan.
What metrics does Redstone calculate? The platform calculates more than 20 measures including Sharpe, Sortino, Omega, Calmar and Martin ratios, alongside alpha, beta, volatility, maximum drawdown and dividend yield.
Who is Redstone built for? It suits self directed investors, quantitative analysts and finance students who want institutional grade risk analytics without paying for an enterprise data terminal.
Does Redstone execute trades? The site presents the product as an analytics and tracking layer combined into a single dashboard, rather than an order routing service connected to a brokerage.
Pros & Cons
Pros
- The free Starter tier unlocks every chart and risk metric, so no analytical capability sits behind a paywall.
- Each ticker and portfolio receives a percentile ranking out of 100 across six dimensions, giving instant relative context.
- Coverage of more than 20 institutional metrics including Sharpe, Sortino, Omega, Calmar and Martin ratios goes far beyond typical retail tools.
- Public community portfolios such as MAG7 and an All Weather replication can be browsed and cloned for idea generation.
- Data on 3,400+ securities refreshes daily with five or more years of price history behind every calculation.
Cons
- Historical depth stops at roughly five years, which constrains long horizon backtesting across full market cycles.
- Private portfolios and capacity above five portfolios require the $15 Plus or $50 Pro subscription.
- The site shows no brokerage integration or order execution, so it functions strictly as an analytics and tracking layer.